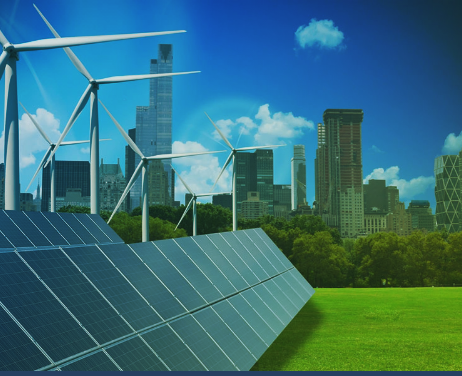
We share the same world, and it is our priority to bring sustainable practices to our business operations. We are continuing our evolution to simply be better at recycling, energy efficiency, reduction of waste and process improvement. We are actively seeking alternatives to critical mineral raw materials and continuously monitoring our supply chain to ensure transparent and ethical sourcing.

Smart energy management practices have clear economic and environmental benefits. We repeatedly enhance the design and build of our products for long term operation that minimize our carbon footprint. Our Worldwide Operational Excellence (OPEX) Council is driving this important initiative.

We have created a baseline environmental impact scorecard across our Business Units. This will help us identify areas in need of urgent attention. It will also allow us to identify how we stand against relevant benchmarks so that we can adopt best practices across Standex.

Our Target: An annual 2% reduction in intensity in the following areas:

  • Water Consumption
  • Electricity Consumption
  • Solid Waste Generation
  • Water Discharge
  • Hazardous Chemical Usage

Environmental Impact Scorecard

ENERGY USAGE

Total direct energy usage consists of electricity and other fuels

METRIC UNIT FY2022
Total Direct Energy Usage GJ 157,560
Total Direct Electricity Usage (Normalized) GJ per million USD revenue 184
Total Direct Energy Usage (Normalized) GJ per million USD revenue 214

ENERGY USAGE BY TYPE

METRIC UNIT FY2022
Electricity GJ 135,438
Natural Gas HCF 205,384
LPG TONS 10
Heating Oil GALLONS 4,656

ENERGY USAGE BY TYPE

METRIC UNIT FY2022
Water HCF (hundred cubic feet) 3,590,748
Waste Water Disposal HCF (hundred cubic feet) 422,247

TOTAL WASTE GENERATED

METRIC UNIT FY2022
Solid waste Cubic Tons 6,377
Recycling Cubic Tons 2,018

TOTAL WASTE GENERATED (INTENSITY)

Total Waste Cubic Tons per million USD revenue 11

ENERGY USAGE

Total direct energy usage consists of electricity and other fuels

METRIC

Total Direct Energy Usage

UNIT

GJ

FY2022

157,560

METRIC

Total Direct Electricity Usage (Intensity)

UNIT

GJ Per Million USD Revenue

FY2022

184

METRIC

Total Direct Electricity Usage (Intensity)

UNIT

GJ Per Million USD Revenue

FY2022

184

METRIC

Total Direct Energy Usage (Intensity)

UNIT

GJ Per Million USD Revenue

FY2022

214

ENERGY USAGE BY TYPE

METRIC

Electricity

UNIT

GJ

FY2022

135,438

METRIC

Natural Gas

UNIT

HCF

FY2022

205,384

METRIC

LPG

UNIT

TONS

FY2022

10

METRIC

Heating Oil

UNIT

GALLONS

FY2022

4,656

ENERGY USAGE BY TYPE

METRIC

Water

UNIT

HCF (Hundred Cubic Feet)

FY2022

3,590,748

METRIC

Waste Water Disposal

UNIT

HCF (Hundred Cubic Feet)

FY2022

422,247

TOTAL WASTE GENERATED

METRIC

Solid Waste

UNIT

Cubic Tons

FY2022

6,377

METRIC

Recycling

UNIT

Cubic Tons

FY2022

2,018

TOTAL WASTE GENERATED (INTENSITY)

Total Waste

Cubic Tons Per Million USD Revenue

11

SCOPE Emissions (tCO2e) Contribution % tCO2 per revenue (mUSD) tCO2 per employee
Scope 1 3,663 15% 4.6 0.9
Scope 2 – Location Based 20,165 85% 25.5 4.9
Scope 2 – Market Based 21,725 27.4 5.3
Total (Location based) 23,828 100% 30.1 5.8

Our Scope 1 & 2 GHG calculations were completed by an independent third party based on data collected through internal calculations. The data may be influenced by various factors, including but not limited to data collection methods, statistical assumptions, and inherent limitations in the underlying processes. We will continue to work diligently to enhance the reliability and accuracy of our reporting processes in the future.

Strategy Oversight

Our ESG steering committee has been established to support standardized sustainability and social responsibility initiatives. Together with Operations, Supply Chain and business leadership, the committee collaborates on policies and strategies for sustainability and ethical practices, progress monitoring and ensuring transparency and accountability to stakeholders.

View our Environmental Policy