Learn how Standex enhances everyday life. Watch now »
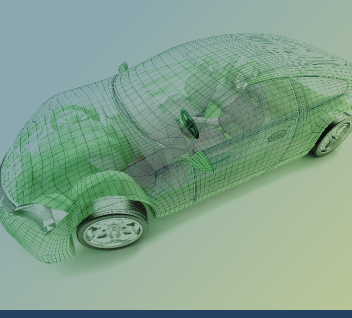

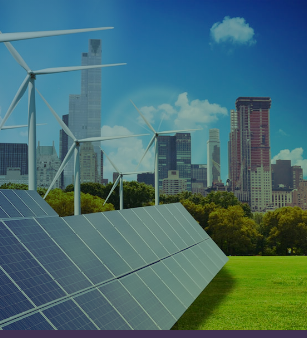
Every day, we connect people, products and technologies to help create what’s next. Our businesses provide vital inputs to propel critical industries to address some of the world’s most compelling needs such as renewable energy, the commercialization of space, electric vehicles and refrigeration for the life sciences.
About Standex
We are a global industrial growth company operating through our market-leading brands in electronics, cutting-edge forming technologies, engraving and scientific refrigeration. We work with our customers to advance progress through innovation. From inventing and producing parts for next-generation space vehicles, to evolving vaccine refrigeration, designing functional textures for everyday products, improving renewable energy technology and much more, we are focused on making what’s next possible.
Proudly working with leading global brands, our products contribute to their cutting-edge innovations that shape the present and future.


Founded in 1955, Standex International has successfully navigated many market and economic cycles. Standex Joined the New York Stock Exchange in 1965, (NYSE: SXI), and today is one of only 10% of companies listed in 1965 to still be listed today and has delivered a dividend each quarter on the Exchange.
Investors Portal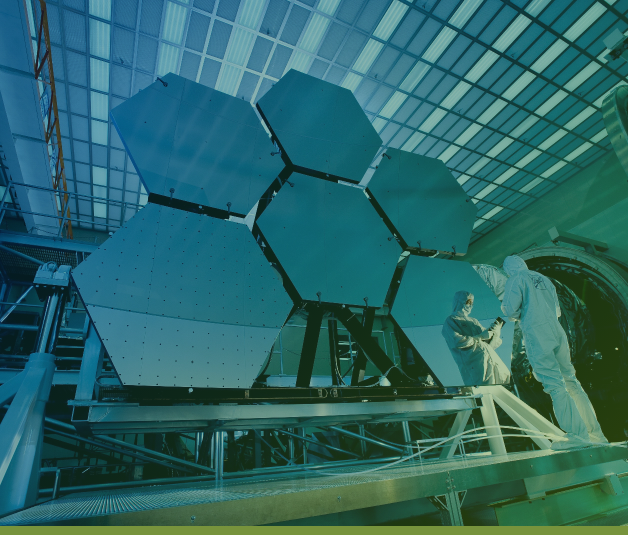

We put people first. Our problem-solving culture and the people at the heart of it are what make Standex a great place to work, grow and thrive. Here, each individual plays a key role and everyone makes a difference. We invite you to bring your talents to our growing global company and grow through our diverse career development opportunities.
Careers PortalWe aspire to make and keep compelling promises to all stakeholders, our customers, our employees, our shareholders, our communities and the broader world in which we live and work. We intentionally focus our energies where we can help develop solutions to the world’s greatest opportunities and most compelling needs. This extends from developing innovative products for customers in renewable energy and electric vehicles to monitoring our individual site’s consumption and emissions. Our priority is to bring sustainable practices to our business operations, cultivate an environment of inclusivity, create innovative solutions for our customers and help the communities where we live and work.
Learn More